Sunday, April 28, 2024

NBA shot data and the mean center

I've been watching NBA basketball since the early 1990s and one of the biggest changes has been the way the center position is played. But more on that in a minute. I'm also a spatial data analyst and if you look at my previous post you will see that I've shared links to NBA shot data as well as some court data I made.  That got me thinking about the concept of the 'mean center', which in this case has two meanings.


Read on for an explanation of this


1. Mean center = Shaq, and players like him who played aggressive basketball close to the hoop in the old-fashioned way. I started off my own basketball career as a center before I went all soft and started shooting threes as a small forward.


2. Mean center = the spatial analysis concept of the 'mean center'. This is just the average (mean) position of all points so we can get a sense of where the average shot is taken from. I thought I'd take all the NBA shot data I had, from 2003-04 to 2022-23 and see where the average shot from centers for each year was taken from. And I also mapped all shots taken. See below for the results.


Clearly, as we can see from the location of the mean center, the mean center in the NBA has become less of a mean center, if we are to take the mean center shot position as an indicator. No matter how you interpret it, the shot chart for centers in 2022-23 looks radically different than it did in 2003-04. I will leave others to debate whether this is a good thing or a bad thing. But I do think teams should have a mean center and that the mean center becomes less mean when they shoot lots of threes. I mean, I love Jokić and the way he plays but I really loved Zo and his ferocity.


In the images below, every red dot is a shot taken by an NBA center during the regular season. The bigger dot closer to the basket with the label 'MEAN CENTER' is the average position of all shots in each season indicated in big numbers at the top left of the image.


You want a gif, don't you? Okay, here you go.


A gif of all years? Ok, here you go.

A small multiple, you say?

A mean multiple


PS this may be my last ever blog post but I will keep the blog online in case I change my mind. I've been doing this for more than 15 years and I think it's had its day.

Saturday, March 23, 2024

A long read about NBA shot data

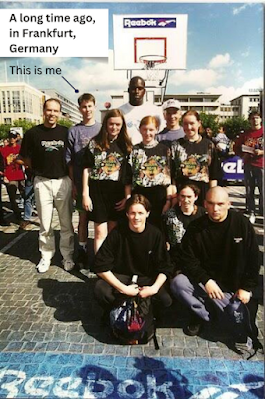
I used to play basketball and I do a lot of data analysis and mapping, but I haven't actually blogged about it before, so here I am. Scroll to the bottom of this post if you want to see an old photo of me and some other Scottish basketball players standing beside Shaq. Otherwise, read on!

NBA shot data

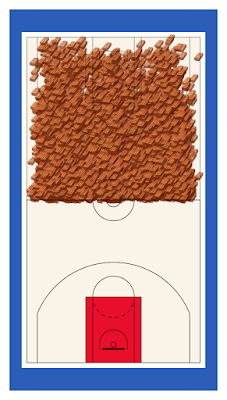
You can get NBA shot data via the NBA API but there are lots of other ways, and some kind people on the internet have already shared it themselves, so that's what I'm using here, thanks to Dom Samangy. In order to add something useful, and so that people can map shot data against a real NBA court I also created a folder where I shared various files that can be loaded into QGIS (or other software) so that the NBA shot data isn't just loads of points floating in space. When you add all shot data for the 2003-04 season to the 2022-23 season, plus my NBA court files, it looks like this, below - over 4 million shots! I loaded up the full csv and then converted it to a SQLite database and it works really quickly in QGIS.

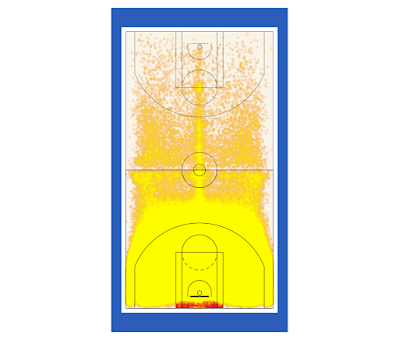
That's a lot of shots

Explore the data

Okay, so looking at over 4 million shots doesn't really tell us much, even if it is quite interesting. What is a lot more interesting is being able to filter and query the data in all manner of ways since we have lots of different columns associated with each point - like the date, who took the shot, whether it was a make or a miss and all sorts of stuff. If you're an NBA fan like I am then you can query it to find particular games or players - although just bear in mind that the data I've linked to above that I'm using here only covers the regular season. But it covers a 20 year period of NBA history where the game has changed in significant ways - not least of which is the rise of the 3-pointer. 


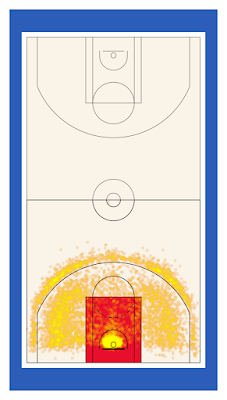
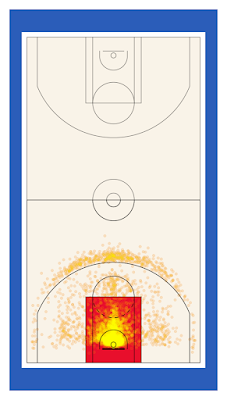
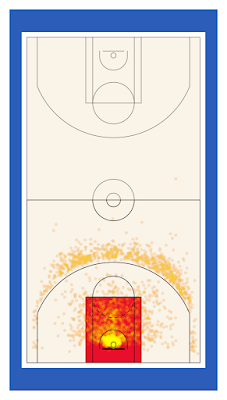
With that in mind, let's look at made 3 point shots in 2003-04 (left) vs 2022-23 (right). Lots more threes recently, big surprise! But what about if we filter it by position and look at made 3-pointers by centers in 2003-04 vs 2022-23? Well, in 2003-04 there were 149 made 3-pointers by centers vs 2,138 in the 2022-23 season. Dirk played center for the Mavs in a few seasons, including 03-04 so he actually accounted for 99 of the 149 that year. Vlade Divac had two, Ben Wallace had one.

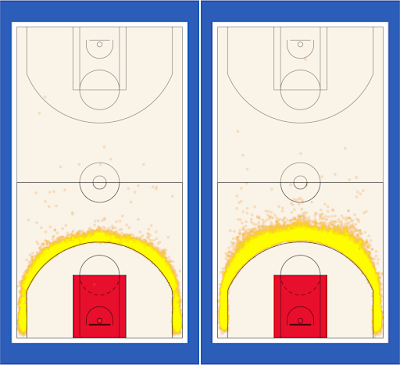
A not very surprising change

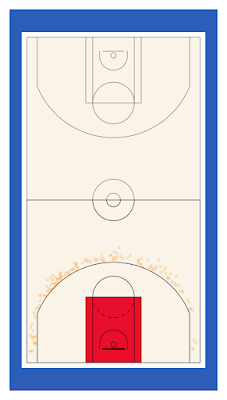
Dirk scored 99 of these!

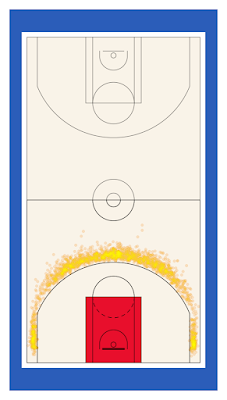
Brad Lohaus? Anyone?

Asking questions and finding answers

If you're a hoops fan, and know what you're doing with data you can use this dataset to ask and answer all sorts of interesting/random questions about NBA shots over the years. For example, if I wanted to find out how many shots have been taken from the backcourt in the 20 seasons from 20003-04 to 2022-23 then I could easily find the answer - 8,179 misses and only 208 makes!

A few bricks

But what about those half court heaves that actually went in? Well, I counted 208 of them (remember that this data covers regular season only). Jamal Crawford is at the top of the list, with 6 - then Steph Curry and Zach Randolph with 5 each. Then Dwyane Wade, Jason Kidd and Raymond Felton with 4 each. But what about that really long shot from under the opposite basket? Who scored that and is the data correct? Well according to the data, that shot was by Vince Carter when he was playing for the Grizzlies in the 2015-16 season so let's just Google 'vince carter full court shot grizzlies' and see what we get. If you look at the video you'll see that it doesn't exactly match the data point, but still a great shot.

Not a sure thing

And what about that long diagonal almost-full-court shot from the upper left of the image above? Well that was LeBron for the Cavs in the 2006-07 season vs the Celtics, in Boston - as you can see in this clip.


Individual players

The possibilities are endless with this kind of data and mainly I've been using it to explore things that interest me - e.g. the relative decline of the mid-range shot and the games of players like Carmelo Anthony (below).

A great player!

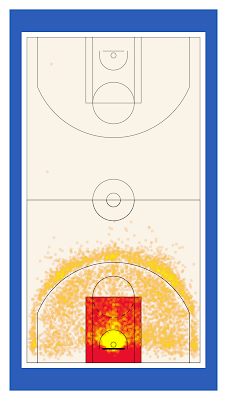
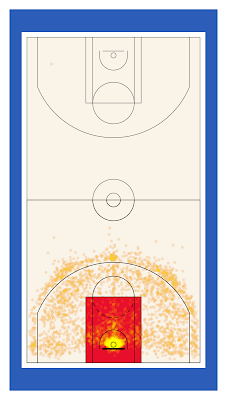
I'll add below some more for Shaq and Yao, because these are quite interesting given the way the game has changed and moved away from the basket.


How about that Embiid, Jokic and Luka? Their charts look like this when we include all made shots in the regular season.

Joel Embiid, made shots

Jokic, made shots

Luka, made shots

The analytical possibilities are endless, and if you want to download it and aggregate it into hexes then I also have a hex layer in the folder alongside my NBA court files (I digitized all these myself).


LeBron

A very brief look at the NBA's all time leading scorer to end, not least because there are so many data points for LeBron! Over 14,000 made shots in the 20 seasons I have data for.

The King

Here are LeBron's shot charts (made shots, regular season) for his first stint at the Cavs, then the Heat, then the Cavs again and then the Lakers.

Cavs LeBron (1)

Heat LeBron

Cavs LeBron (2)

Lakers LeBron


Try it yourself

If you want to play with the data yourself then you can download it via the links in this post and if you want to have a play around with it in QGIS and aren't sure how then check out my YouTube playlist showing you how to do it. I haven't even scratched the surface here but it's so interesting, particularly if you're a basketball nerd.


You can see how much Shaq loved this!

The image above was taken in Frankfurt, Germany in 1994 (I think). I competed in the dunk contest, but lost out to someone who dunked over a life-size cut-out of Shaq. For one of my dunks I went with a dunk I saw Kenny Smith do, but the judges were very harsh.

Friday, January 26, 2024

Exciting facts about UK postcodes

I have some exciting facts about UK postcodes and I'm going to post them here. My data source is the ONS Postcode Directory (ONSPD) and I'm sharing this information here because it's all incredibly interesting and you know it. If you have a list of UK postcodes that you just want to turn into lat/long or eastings/northings then Doogal's batch geocoding tool is what you need. He really is a hero. But anyway, back to the boring stuff.

Okay, let's start with postcode extremes by latitude and longitude - here's a map of that.

Well, now we know

What about longest straight line distance between UK postcodes? It would appear to be ZE2 9EQ in the north of Shetland to TR22 0PL in the Isles of Scilly.

Currently £1.25 to send a letter first class

In the ONSPD file I used, downloaded in January 2024, there are 2,697,530 postcodes - and by that I mean there is a point for each full postcode unit in the UK with a geographic location - e.g. NW1 1AA. But hold on a second, this is way more than the actual number of UK postcodes so what's going on? 

Red Road flats, Glasgow (CC, Miles Glendinning)

The ONSPD file also contains postcodes that are no longer active - for example for areas where lots of buildings have been demolished like in the case of the old Red Road flats in Balornock / Barmulloch in Glasgow, and lots of other examples across the UK. They are still in the file but you can easily filter them out using the DOTERM column (this column indicates when a postcode was terminated):

"If present, the most recent occurrence of the postcode’s date of termination, otherwise: null = ‘live’ postcode"

That's the kind of useful information you can find in the user guide.

Postcodes that are no longer in use

What about postcodes with no geographic location? Well there are about 24,000 of those in the dataset and they don't have a point but that's a bit of a pointless thing to say, isn't it?


How many live, in-use postcodes are there? 

In the ONSPD dataset I'm using here, there are 1,798,027 live postcodes in the UK. And the geographic centre of all of these? Well it happens to fall just to the north east of Barton-under-Needwood in Staffordshire. So now we know that too.

Barton-under-Needed to know this

Should be the capital of the UK, clearly

Other stuff

What about postcodes with an i in them? See below.

There are some IM postcodes in there, but no dots

I quite like the way the Kirkwall postcodes look like they're invading Caithness.


Can't you do some point-in-polygon postcode density maps?

Yes I can. I can do it with squares. Or I can do it with other shapes. This is definitely not pointless because there are more than 1.7 million points so how can it be?

Postcode density by 10km square


5km hexagons, shaded by postcode count (yellow = more)


That's enough of that.

Wednesday, January 10, 2024

CaII me AI

This is my new blog, the third in the series. I started my first blog in 2008 and then I wound down my last one in late 2023 because I was a bit bored of it, and was thinking to myself "You know, I don't find this stuff amusing anymore". I was thinking about maybe doing a Substack or something but I realised I actually quite like having a blog, so I'm going to keep doing it. Do I want a shot at redemption? Maybe.


A great map of Scotland

This first post is really just me saying 'hi, I'm back' and also because I wanted to say a tiny bit about AI and post a map of Scotland made by DALL-E, which described what they produced like this: 

"Here is a conventional and accurate map of Scotland, featuring major cities in their correct locations and other geographical details. This map is styled like a standard geographical map, providing a clear and informative view of Scotland."

Will the rise of AI lead to the demise of the GIS analyst and mapmaker? I don't think so. I submit the map of Scotland above as evidence. All the same, I think there are lots of ways in which AI will have an impact in the geospatial world, in ways we can't yet imagine. It's a street in a strange world! 

When I first started blogging in 2008 we couldn't have imagined the things AI can now do, but what frustrates me most at the moment is how confidently wrong it can often be, even if I have managed to successfully get Bard or ChatGPT to help me do stuff I'd otherwise struggle with. So I still kind of treat it like that oft-cited legal mantra:

"never ask a question to which you do not already know the answer"

To this we could add: "only ask questions where the answer doesn't really matter". That does kind of defeat the purpose but I do wish answers weren't given so confidently much of the time. It is of course quite good at creating sports teams logos though.

The best Aussie rules team in Dundee

Shinty world champions

The newest NBA franchise

The Celtics name change, honoring Brian Scalabrine

This is a bit of a rambling, random first post - for sure - but I got a short little span of attention

I've also been adding in lyrics in italics from Paul Simon's You Can Call me Al just because a) when I see AI it always looks like Al (which is how smart people spell my name in order to avoid mis-spelling Alasdair, which happens like 10 times a day) and b) 

"As we wrap up this initial journey, remember that every map is not just a guide, but a gateway to new adventures and discoveries."
(prompt: please can you write a short sentence for me that I can use as the last sentence in the first post of my new blog, called A wee bit of mapping

reply: Absolutely! Here's a fitting sentence for the conclusion of your first blog post on "A wee bit of mapping":)

But yes, you can call me Al, or Aly or even Alasdair if you want to spell it all out. For now I think when it comes to maps and geospatial I can do a better job than AI but that may change. 

He says, "Amen and Hallelujah!"

Notes

  1. The title of this blog post is actually caii me ai - a reminder that when we're talking about AI we should use a serif font, RlGHT?
  2. The blog header here is an image I made using Aerialod and Ordnance Survey open data. Why that location? It's a nod to the fact that I used to travel on the M62 then M602 then into central Manchester every day from Liverpool when I first started blogging. 
  3. The blog name? Well, of course I say 'a wee bit' all the time and then it's about mapping so that seemed to be about right. Also it's borrowed and modified from the blog title of a friend of mine.
  4. Blogger red underlines shinty. This is how we really know technology is still rubbish.